Campus-level meter data shines light on savings, solar arrays, and Friday night soirees
Many college and corporate campuses save money and integrate higher levels of renewables by taking transmission level service from the utility on one main meter.
Energy managers naturally think that master level meters limit the value of utility analytics; a master meter means that many buildings’ energy signatures are condensed into one totalized meter. Gridium’s experience with Foothill De Anza suggests otherwise — main meter analytics can provide key insights about how campus assets interact to explain energy usage, without the expense, delay and incomplete picture that campus submeters provide.
Foothill De Anza serves over 40,000 students, and has both an industry leading 1.5 megawatt solar photovoltaic system and a 250 kilowatt cogeneration plant on each campus providing energy services to over 200 buildings.
Each Foothill De Anza campus has a smart meter from Pacific Gas & Electric tracking 15 minute demand readings. Foothill De Anza leaders engaged Gridium to explore how analytics on just two utility meters could improve energy management. The data revealed several key insights unknown to staff and have already refined energy management strategies for the future.
For example, plotting the De Anza Campus’ meter data on a heatmap in Gridium’s RCx tool reveals that while the campus typically exported energy during mid-day periods, daily net loads started to increase in August, and remained high throughout September. Weather normalized readings from Gridium’s Snapmeter application show that these levels are well outside typical load response functions for the campus. To see this for yourself, notice that the horizontal white bars disappear in August and September in the heatmap below:

Gridium tools visualizing baseload intensities.
This increase in day time peak load is particularly clear when comparing Saturday load curves. On July 12th, 2014, the De Anza Campus’ solar array was offsetting 100% of its midday energy use (causing a white bar in the chart above), but by September 20th, 2014, the Saturday baseload had shot up above 300 kilowatts:

Saturday basesloads had drifted up over time.
Now, Gridium technology has no idea why 300 kW of extra load showed up. But simple and economical high-level analytics immediately focus staff attention on the expensive daytime load that appeared in September.
A second example reinforces the value of high-level analytics. Main meter data also revealed issues with the campus’ Friday night energy use. In the words of a campus facilities operator, De Anza College is “a real ghost town” on Friday nights… and it should be, because this college program is non-residential, students don’t live, or party, on campus! However, the utility bills seem to tell a different story. You can see below in Gridium’s Snapmeter application that the campus is using nearly 1500 kilowatts at 9:15pm on Friday night, despite an expected baseload for this period being 800 kilowatts lower. The graph below plots predicted values against actuals, showing baseload is not only higher, its much higher than typical readings:
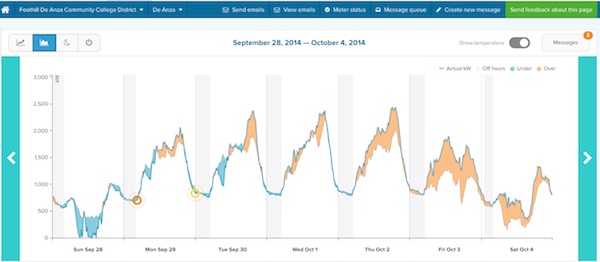
Friday night baseloads are much higher than expected.
Again, we have no idea what shenanigans are at work on Friday evenings. Our role is simply to focus very limited staff attention on the big wins with easy to use and powerful analytics.
These are just two of the many examples that Foothill De Anza Community College discussed at the recent Silicon Valley Leadership Group event on the intersection of energy efficiency and the smart grid.
College campuses present operators with troves of potential data streams from a number of buildings, systems, and equipment. When these streams roll up to a pre-existing data layer, such as the utility’s smart meter, our work with the energy team shows it often makes sense to start at the beginning and mine this easily accessible utility data stream for insight before diving into more complex systems to diagnose a specific issue.

Dont most utility meters on commercial rates have two channels, ie, an import and export channel? Or, is there not generally a net generation output meter installed on each CSI-eligible PV system? If that is the case, a customer can obtain the data in a csv file for each channel and plot the data. One for load And another for export. In so doing, a customer can see the load creep and take action.