Boxing matches are often won between the rounds. In a similar way, building operators who monitor their building during closed hours can generate topnotch savings.
A recent prize fight got us thinking that energy usage can look a lot like the rounds of a boxing match. What happens in your building between workdays is as important to your building’s performance as the flurry of activity that happens between rounds in a boxing match.
As we’ve discussed before, building consumption overnight and on weekends can account for 70% of an average building’s total energy use. That’s one reason Snapmeter monitors so closely excess use during off hours. In this “Pro tip” post, we’ll dig into how Snapmeter does this at the click of a button.
Snapmeter connects to your building’s interval meter data through the utility’s website, meaning no hardware or onsite meters are needed. Building operators are busy, so Snapmeter delivers directly to building operators a Monday-morning summary email that recaps the weeks insights.
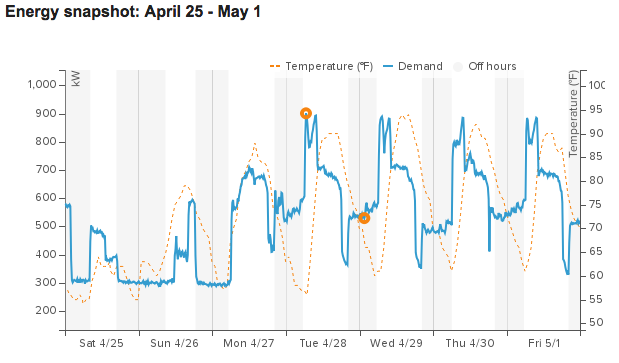
The screenshot above shows a summary graph of a building’s load curve from the prior week, which includes one beacon for the peak demand set on Tuesday at 6:30am and a second beacon for an elevated baseload after the building shuts down in the evening. The Snapmeter email also includes text explaining the beacon in more detail:
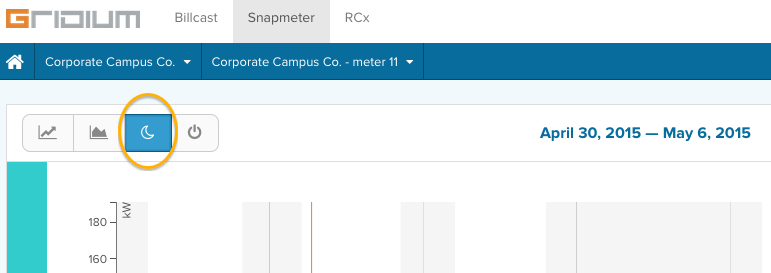
A simple click on that email will take a building operator to a website where she can quickly toggle weekly load curve analysis from deviations between actual energy use and expectations, changes in startup and shutdown times, and off-hours use:
Snapmeter monitors your building’s off-hours use by leveraging two types of insights into your building’s load curve: the times of each day typically representing off-hours for your building (grey bars), and your building’s typical overnight baseload, shown with the yellow line:

The shaded red area makes it clear to the user when Snapmeter detects the building is in the off state but above its baseload level (therefore consuming more energy during off-hours than it should). The graphical language makes it clear and helps the operator ask the key question — if you can turn it off on Tuesday night, why can’t you turn if off every night?
These insights don’t require user input. Off-hours are automatically calculated by Snapmeter based on the building’s own historical interval data and will adjust if building hours adjust.
In many buildings, when nights and weekends roll around, the cleaning crews can look a lot like a boxer’s cutman working furiously to prepare the building for the next round. That often explains a slow ramp down to baseload over night, but rarely would it explain the excess energy use over Sunday as shown above. This is a clear sign that an operator should dig in and start the hunt for savings.
If you have further questions about how Snapmeter’s analytics can help your building run more efficiently, please let us know.
